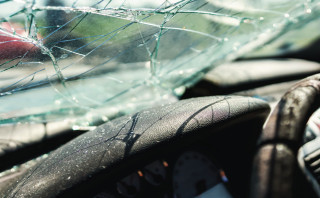
Why we crashed in 2021
We normally take a reasonably light-hearted tone with articles. That doesn’t feel quite right for this one though. That’s because we’re going to talk about crash statistics and share some numbers with you. They come from 2021 as they’re the latest we have. Judging by the pattern from previous years, that doesn’t matter too much and 2022 will likely have been similar as the main causes of accidents are generally the same every year. And we’re doing a lousy job of changing that.
An Overview of NZ Road Crashes in 2021
Every year the Ministry of Transport Annual Crash Statistics breaks down the numbers behind the crashes on our roads. It’s not the most pleasant reading and deals with serious incidents and fatalities. It is necessary reading though. The data helps tell a story of what’s going on on the roads. So what is going on?
In 2021 the total number of deaths on our roads came to 318. This figure doesn’t include any deaths caused by a medical or non-accidental event, such as a heart attack or suicide. Also missing from the total are any deaths on non-public roads or a road where the public has no access, such as a race track or farm paddock.
The good news is 318 is the lowest number of deaths on record since 2015. It’s a move in the right direction, although it’s significantly higher than the 2013 total of 253 deaths.
The bad news is that from the data we have so far, many of the causes of crashes remain the same – with drink, drugs and speed continuing to play a large part. Broken down by vehicle type and some contributing factors, the 2021 crash stats courtesy of transport.govt.nz are made up as follows:
167 people driving
An increase of 13 on the previous year, ending a 3-year-long declining trend, this was the 4th highest total of the decade from 2011 to 2021.
73 people who were passengers
Another increase (+10 vs. 2020) and another end of a 3-year declining trendline. However, the total can be considered low by overall historical standards.
7 people who were cycling
Down for the 3rd year in a row and below the historical average. This is a positive result considering cycling’s increase in popularity, with 73 million cycle trips undertaken in NZ every year.

46 people who were motorcycling
Down from 57 in 2020 but still stubbornly high. It underlines the disproportionate risk facing motorcyclists on our roads, who make up less than 4% of vehicles on the road but account for 14% of deaths.

25 people walking
The joint-lowest figure on record (tied with 2015 & 2016). The (hopeful) presumption is there’s a greater understanding of the dangers of the road and people are taking extra care and attention.

128 deaths in crashes involving alcohol/drugs
It might be the lowest total in 5 years but it still makes for a sobering statistic, with 40% of all road fatalities involving alcohol and/or drugs.

122 deaths in crashes involving speeding
An increase from last year and the highest number since 2010. Almost 40% of all road fatalities include speeding as a contributing factor.

5 deaths in crashes involving overseas drivers
A repeat of last year's total and the joint lowest number recorded since 1990, no doubt contributed to by a reduced number of overseas drivers on New Zealand roads at the moment.

80 deaths in crashes involving trucks
An increase of almost 25% on the previous year and the second-highest total in the last 15 years.

25 deaths in crashes involving fatigue
Tied with 1998 for the joint lowest number in the records we've seen, which run from 1990.

10 deaths in crashes involving diverted attention
A big improvement on last year's total of 25 and the lowest total ever recorded.
There does not appear to be any released data so far on crashes where the cause is mechanical – for example failing brakes or bald tyres.
Viewing these numbers in isolation is insightful but removes the most critical context. That is, based on released data so far, drink, drugs and speeding remain the leading causes of deaths on our roads. It’s hard not to bemoan the fact these deaths might all be preventable if better decisions were made.
Please make sure you make good decisions. Stay safe out there.

-
Topics:
- Road Safety
More tips and articles
Product Spotlight:
Maxxis HT780 RAZR HT
Understand the link between traction and compaction