UTQG Ratings & European Labelling Explained
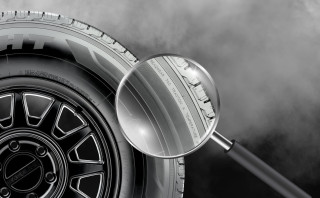
Ok, so there’s a lot of letters and numbers on your tyres. Whilst it would be easy to think they are communicating secret messages to a shadowy illuminati (well - they might be) they actually have a far more mundane and straightforward purpose. The good news is you don’t need an enigma machine to decode them either. You just need to keep reading.
Why Your Tyres Have Numbers on Them
Those numbers on your tyres had to come from somewhere. Understanding their history is important as the same numbers on different tyres can mean different things. Huh, we hear you grunt. And you’d be right. Because whilst understanding UTQG ratings may be straightforward, there are some differences hiding behind them. All things in good time though. Let’s start at the start. Hold onto your hats folks, we’re heading Stateside and to the year 1966.
The American Senate is about to vote on S.B 2669. This lovely little bit of legislature is to become more fondly known as the Motor Vehicle Safety Act. Before it gets to the Senate though, the well intentioned and rather outstanding conservationist, Gaylord Nelson had an amendment tacked on.
It was worth adding something about tyres into the bill too. In 1965, the leading cause of death in those under 44 was from an automobile accident. At the same time, a chap by the name of Ralph Nader was being hounded by undercover Private Investigators at the behest of General Motors. Ralph had just published a book called ‘Unsafe at Any Speed’ which wasn’t overly positive towards the Chevrolet Corvair and GM wanted some dirt to discredit him (they failed - but did draw attention to themselves in a negative way). So, the time was right to try and tighten up vehicle safety a bit.
It’s just a shame the US Congress didn’t tighten up on their attention to detail and use of words. For when the amendment was added, the wording ‘required’ the Department of Transport to get a tyre grading system in place within two years. It seems the Senators were under the impression they were authorising a feasibility study into a tyre grading system, not passing a rule to set one up. Yup - the word ‘required’ had hoodwinked them all. Tricky.
The end result was a rush to get something in place without the due diligence required to make sure it would work. Well, when we say rush, we mean it took not the 2 years dictated by the agreed timeline but 13 years of wrangling, back and forth, complaints, court challenges and general red tape and other nonsense. It took a 1978 US Government funded study (“The Uniform Tyre Quality Grading System: A Case Study of the Government Regulatory Process”) to really draw under a line of the talking and bickering. So, in 1979 the UTQG system finally swing into action. What did it do? It graded tyres based on treadwear, traction and temperature resistance.
Treadwear
Right - the idea of a treadwear rating is to indicate to the consumer just how long the tyre might last. It’s a noble concept considering the importance purchasers attach to tyre longevity. The rating itself gives you a number which compares the tyres tread wear rate vs that of a control tyre. The control tyre is graded 100. If the tyre being tested is awarded a rating of 200 then it means the tyre will last twice as long as the control tyre. A rating of 600 means the tyre lasts at least 6 times as long.
Traction
Tests are conducted on US Government approved surfaces in the wet. The tyre are then assigned a grade based upon their braking performance. The grades run from AA, A, B, C, with AA being the best, C the Worst.
Temperature
A similar grading approach is given when it comes to temperature. In this instance, the grades attainable are either A, B or C. As before, ‘A’ denotes the highest rating. The logic behind providing a temperature guide is that as tyres heat up they can deteriorate and may lead to a blow out. A tyre awarded an A grade is able to dissipate and resist heat buildup well. A grade C tyre cannot and is, theoretically, more of a risk.
What The Numbers Don’t Tell You
The system described above kind of makes sense right? You provide a rating system which will arm consumers with knowledge of how long the tyres will last, how they perform in the wet and how they handle heat build-up. You see that information displayed on a tyre and you can make a good call on whether that tyre is good, bad or indifferent. But here’s the thing...the tests aren’t centralised so comparing the results gives a false indication of tyre performance.
Huh you say? Let’s explain. It’s the manufacturers themselves that test and grade their tyres. No Government monitoring takes place to ensure consistent application and the guidelines provided, whilst robust, are not necessarily exhaustive enough to eliminate every variable. We’re not saying tyre manufacturers are purposely misleading you. We’re saying when you compare the UTQG rating from one manufacturer to that of another, beware. You’re likely not comparing apples with apples. Let’s get a little more specific and work through an example...
Manufacturer A has provided a treadwear rating of 700. This indicates the tyre will last 7 x longer than the control tyre. The warranty provided on this tyre is for 100,000 miles.
Manufacturer B has provided a treadwear rating of 700. This indicates the tyre will last 7 x longer than the control tyre. The warranty provided for this tyre is for 85,000 miles.
Something isn’t right. If both tyres have a rating of 700 why is the warranty different? Maybe one manufacturer doesn’t want to over-promise but given the importance attached to longevity by consumers it would be hard to see a manufacturer downplay how long their tyres might last by providing a shorter warranty.
Let’s look at it another way. If Manufacturer B has a provided a rating of 700 against a tyre with a warranty of 85,000 miles - does this mean the control tyre would have a warranty of just 12,142 miles? For the average NZ motorist this means the control tyres would last just 18 months or so.
Nope. Something is wrong here. The nub of it is the traction ratings, given the lack of controls in testing, only really provide an indication of longevity when compared within a brand. They don’t work across brands. That is, if you look at the tyres from Manufacturer A, you know their tyres with a rating of 800 should last twice as long as those they rate as 400. Just don’t compare their ratings against those from Manufacturer B.
Confused? You wouldn’t be the only one. Take a look at this table which highlights the issue and why you’re right to be confused.
Treadwear Grades vs Stated Warranties (Examples)
Mileage Warranty |
Brand Type |
UTQG Rating |
Miles/UTQG Point |
| 40,000 | Major | 300 | 133.3 |
| House | 400 | 100.0 | |
| Private | 440 | 90.1 | |
| 50,000 | Major (1) | 300 | 166.7 |
| Major (1) | 400 | 125.0 | |
| House (2) | 420 | 119.0 | |
| House (2) | 460 | 108.7 | |
| 60,000 | Major | 340 | 176.5 |
| Major | 360 | 166.7 | |
| Major | 440 | 136.4 | |
| Private (3) | 520 | 115.4 | |
| Private (3) | 580 | 103.4 | |
| 70,000 | Major | 480 | 145.8 |
| Major | 500 | 140.0 | |
| Major | 620 | 112.9 | |
| 80,000 | Major | 500 | 160.0 |
| Major (4) | 520 | 153.8 | |
| Major (4) | 620 | 129.0 | |
| House | 640 | 125.0 | |
| 85,000 | Major | 540 | 157.4 |
| Major | 700 | 121.4 | |
| 100,000 | Major | 700 | 142.9 |
Note: Tires from the same brand are indicated by a number next to the brand type.
Does the table make sense? No, it doesn’t. It shows tyres with either identical or near-identical UTQG Ratings have different Mileage Warranties. In other words, the UTQG ratings are pretty meaningless if you want to compare tyres.
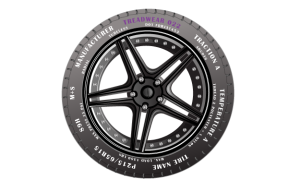
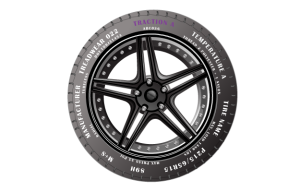
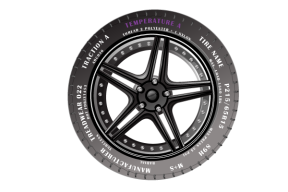
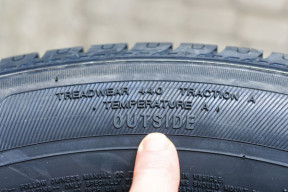
Anyway, here’s what they look like on a tyre.
European Tyre Labelling: Explained
Let’s leave the States and head to Europe. They like to provide some numbers and letters for your tyres too. Indeed, they mandate it...it’s a law and everything.
The European labelling focuses on 3 aspects of tyre performance. Namely; wet grip, fuel efficiency and tyre noise. We think it’s worth noting they don’t focus on tyre longevity. We’ve long thought longevity is a redundant measure of tyre performance (it’s no good if a tyre lasts if it provides the traction of a unicycle on a frozen lake).
The labelling is a little simpler and more specific than the UTQG system (seriously - why have one grade at AA and one only up to A? Even the rating system is inconsistent so it’s no wonder the results are similarly muddled and misunderstood).
With the European labels, both Wet Grip and Fuel Economy are rated on a scale running from A to G (A being the best). Tyre noise is, rather logically, labelled by decibel level.

Wet Grip
Testing assumes a speed of 80km/h in wet conditions. The grade awarded signifies tyre performance on a continuum from Grade A, with a wet braking distance of 28 metres, through to G with the longest braking distance. For consumers, you can easily understand it makes sense to get the tyre with a higher grade.

Fuel Efficiency
The rolling resistance of a tyre can have a big impact on fuel efficiency. So this rating provides a simple to understand guide as to how your tyre choice will affect the need to stop at the petrol station. Again, tyres are graded A through to G. Each grade denotes a difference in fuel consumption of around 0.1 litre per 100kms driven.
Let’s spend a bit more time on this as a difference of 0.1 litre per 100kms probably sounds like a drop in a bucket (which...well...it would be). A shift from a tyre with a Grade G fuel efficiency rating to an A grade is a difference of 9%. Say your vehicle uses a pretty average 8 litres per 100km. Over the life of the tyre (around 65,000kms) you’d be saving 440 litres of fuel. The average full price for 91 in New Zealand was $2.48 earlier (as at 24 April 2023). Meaning a shift to Grade A tyres could save you $1000+ over their lifetime. That’s a massive saving and suddenly makes those more expensive tyres that provide you and your family with better grip much more affordable.

Noise Level
The labelling is displayed with the use of 3 different levels of black soundwaves. If the label has just 1 of the soundwaves coloured in, it means the tyres are considered quiet and 3dB or more below the European limit. 2 soundwaves make for a moderately noisy tyre. If all 3 are filled in then you have a tyre which wails like a banshee (or is above the European limit anyway).
The European ratings are arguably more useful than their American counterparts, being more standardised and allowing a degree of comparison across brands. This is especially helpful when selecting products; the ratings make it easier to determine the best choice.
A Meaningful Conclusion
So there we have it. There’s a lot more numbers and letters on your tyres too. All mean something...it’s just some mean more than others and some mean less, or are relatively meaningless. What we mean is, unless you understand them all they won’t mean much and less is not more in this case. Right then...time for a lie down now.

Get tyres handpicked for NZ conditions
-
Topics:
- Road Safety
- Tyre Technology
More tips and articles
Product Spotlight:
Maxxis HT780 RAZR HT

Understand the link between traction and compaction